

Welcome to the FXDD Research: On the Daily newsletter. This publication provides readers with a sliver of our research process to help contextualize daily economic and market developments across the globe. We designed FXDD’s research process to be intuitive and actionable; therefore, you can expect regular call-outs on risk-reward scenarios we think are lucrative. We typically follow global macro markets, particularly the US, UK, EU, Japan, China, alongside the aggregate World economy. We also follow global assets, i.e., stocks, currencies, commodities, and fixed income (though to a lesser extent). We quantitatively do all this; therefore, you can expect most of our analysis to be standardized, consistent, and repeatable.
Week 5 2022:
Last week was pretty light on economic data but jam-packed with market-moving events. The biggest shift in markets happened following US CPI on Thursday, with US CPI coming in at 7.5%, the highest level in 40 years! Markets quickly moved to price in hikes by the Federal Reserve in response to this, pricing in 6.5 hikes this year! In other news, the ECB began to pivot on its stance regarding interest rates, suggesting we could see the first ECB rate hike in decades. In our view, Central Banks are now in a race to tighten their respective financial conditions, however, we think markets may have gone too far, too fast.
Turning to the week ahead in global macro:
Global Economic Momentum: Markets will focus on a host of data, coming from the UK (average earnings, claimant counts, & retail sales, CPI) and US (retail sales, PPI, building permits, and home sales). Also, we will get Q4 GDP data from Japan.
Global Policy: We won't see too much on the global policy front next week, however, the FOMC will release the minutes of its January meeting. Markets will likely fixate on the "Fed-speak" to guess what the Fed will do next.
Global Market Trends: Global markets continue to whipsaw, but commodities prices continue to stay elevated, telling us inflation is the dominant trend in markets. However, with prices of important commodities like oil (which is now in the $90s) at all-time highs, the pressure is beginning to emerge on the global economy. Soon these prices are likely to have negative effects, and markets will turn risk-off if this happens.
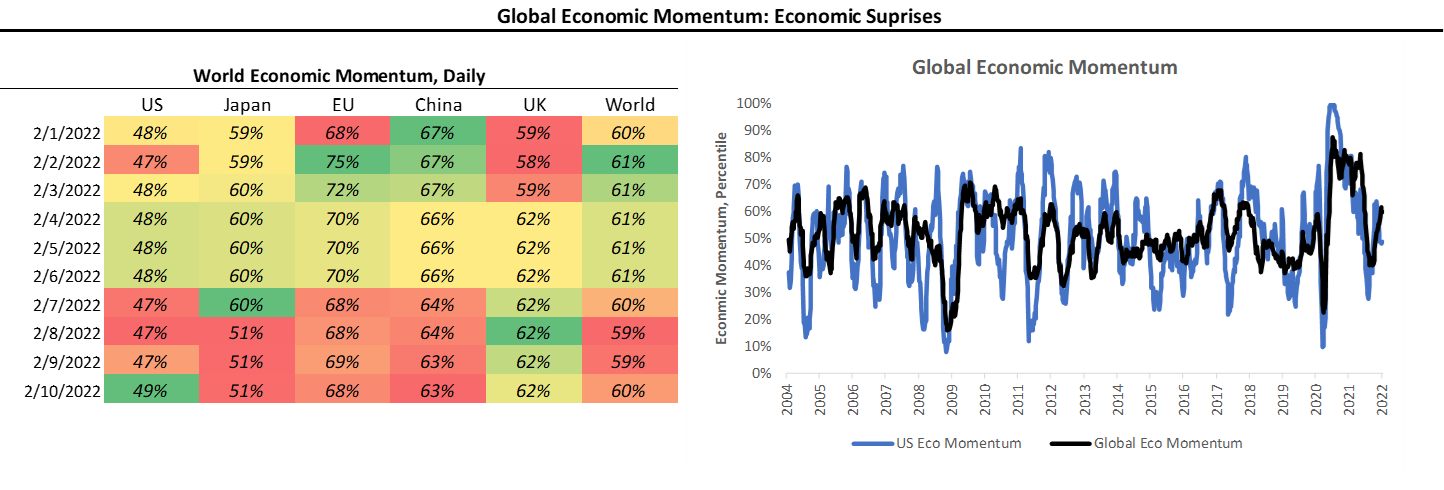
Global Economic Momentum: Daily
We start by tracking economic data relative to consensus expectations, as the impact of financial data on markets depends on whether its surprises the upside or downside. We standardize this data and call this indicator Economic Momentum, i.e., higher values are positive and lower values are negative. The color-coding in the table represents higher/more downward momentum for a given country:
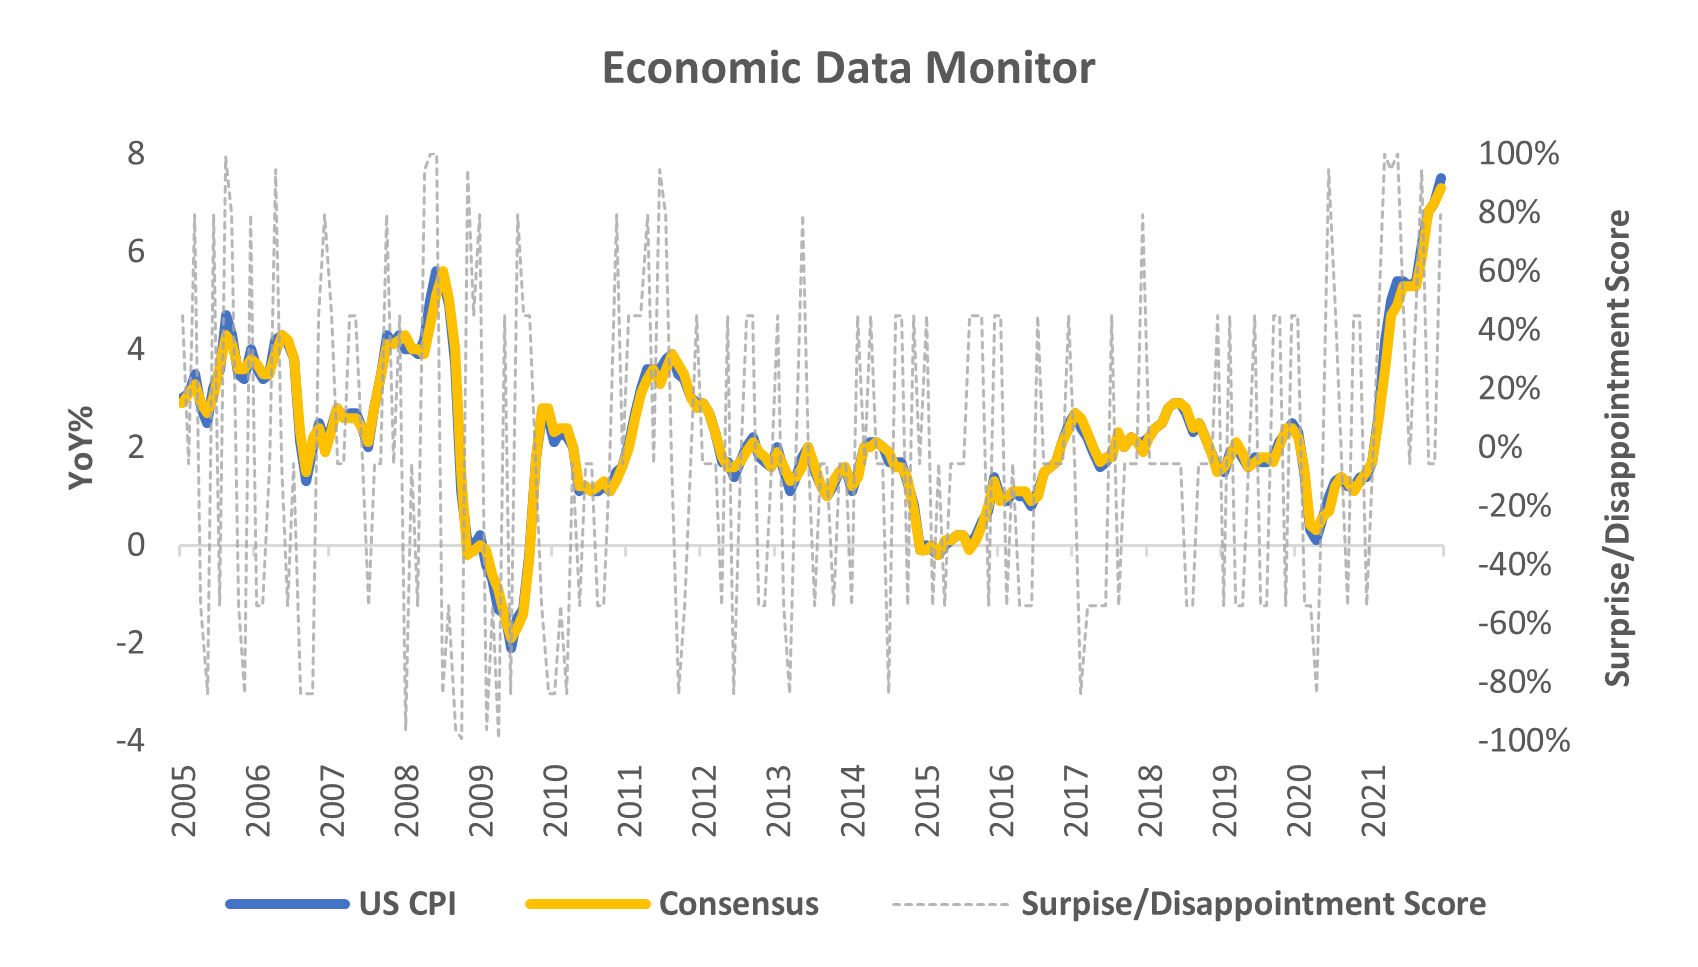
Economic Data Monitor: Today's Data
Under the surface of our Global Economic Momentum Indicators, we track each and every piece of data that impacts Economic Momentum. We highlight the most recent data for today below. We also show its surprise score, rates from -100 (surprise) to 100 (disappointment):
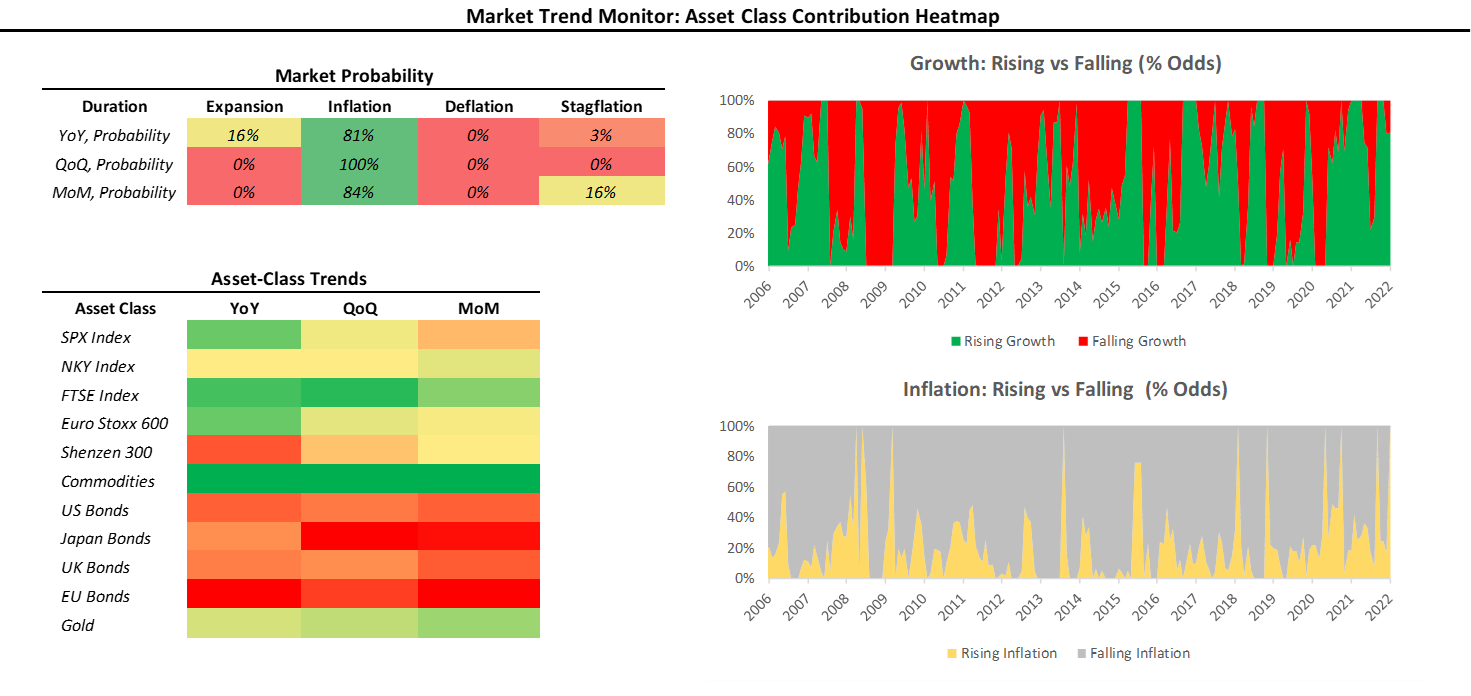
Market Trend Monitor: INFLATION
The table below shows the current market probability of the global economy experiencing expansion, inflation, deflation, or stagflation. The two charts show the odds implied by markets that economic growth is rising or falling, or inflation is rising or falling. Finally, the heatmap shows the contributions of major investment markets to these signals. There are three levels for our market probability estimates (monthly, quarterly, and yearly). We typically take the most signal from the yearly gauge and associate more informational value to higher frequency measures.
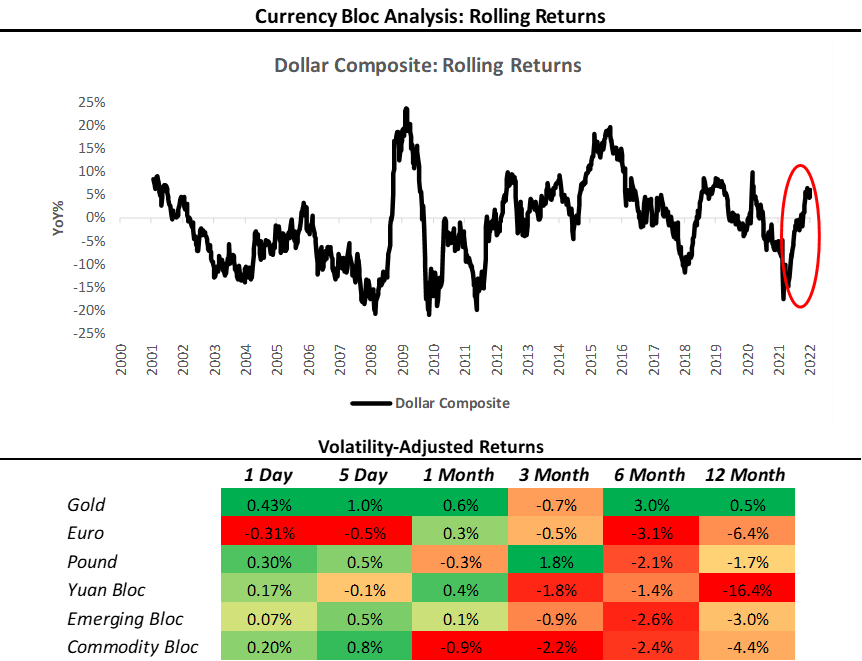
Currency Bloc Monitor: Dollar Composite
We proxy global capital flows using our Currency Bloc Monitor. The Currency Bloc Monitor aggregates FX price data from currencies that share high correlation characteristics, allowing us the gauge which area or asset in the global economy is attracting cross-border capital. The color-coding in the table reflects the strength of a Currency Bloc versus others for a given time frame. We aggregate these currencies versus the dollar and show our Dollar Composite below:
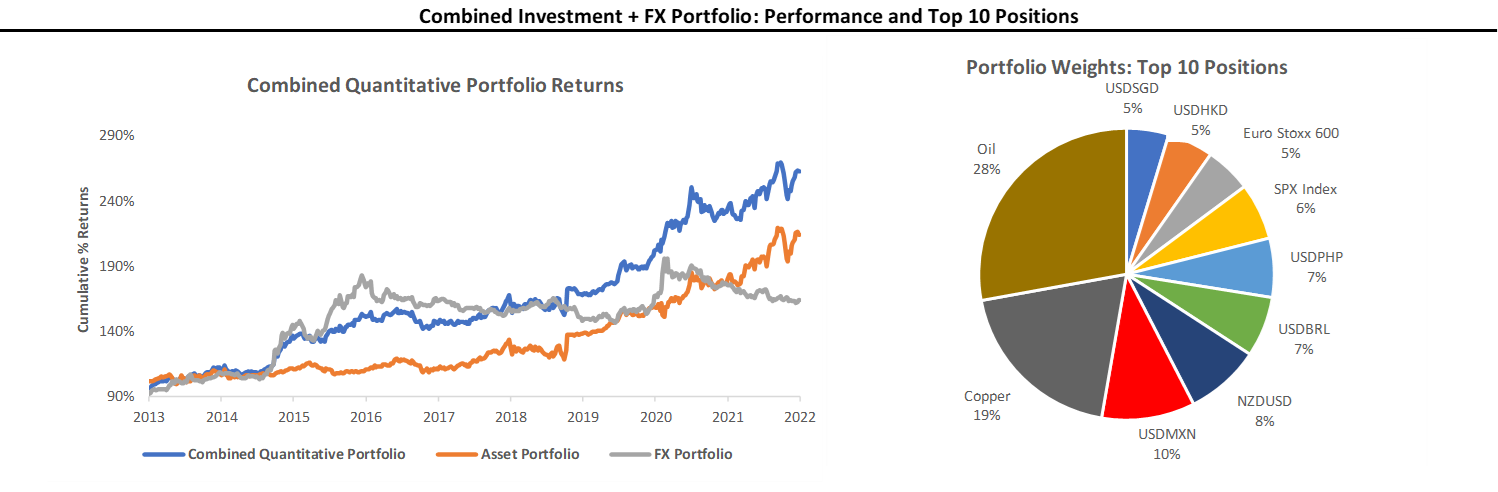
Quantitative Portfolio
We can construct a rules-based, quantitative model portfolio using our various models to detect price trends. This portfolio uses estimates of price trends, volatility, implied volatility, and macroeconomic drivers to allocate to different assets. Below, we show its most recent allocations:
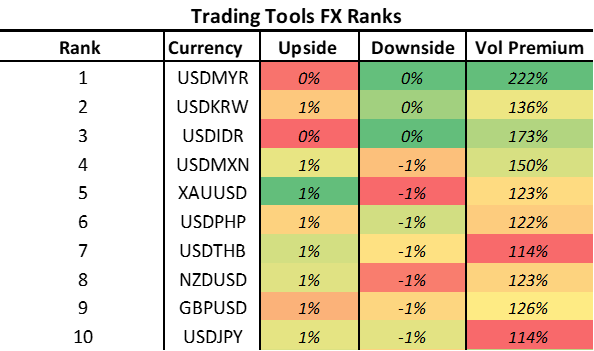
FX Signal Ranks: Top 10 Signals
In addition to providing our Quantitative Model Portfolio, we also provide our top 10 FX signals for the day, which our model selects from on a weekly basis. The rankings below reflect the strength of the signal:
We look forward to sharing our extensive library of content with you over the months to come. If you enjoyed these materials, feel free to share this with friends or colleagues, and don’t forget to subscribe for more!
Disclaimer: 75% of Retail Client accounts lose money when trading CFDs with FXDD Malta. You should consider whether you can afford to take the high risk of losing your money.