

Welcome to the FXDD Research: On the Daily newsletter. This publication provides readers with a sliver of our research process to help contextualize daily economic and market developments across the globe. We designed FXDD’s research process to be intuitive and actionable; therefore, you can expect regular call-outs on risk-reward scenarios we think are lucrative. We typically follow global macro markets, particularly the US, UK, EU, Japan, China, alongside the aggregate World economy. We also follow global assets, i.e., stocks, currencies, commodities, and fixed income (though to a lesser extent). We quantitatively do all this; therefore, you can expect most of our analysis to be standardized, consistent, and repeatable.
Before we dive into our trading signals, here are the latest developments in global macro:
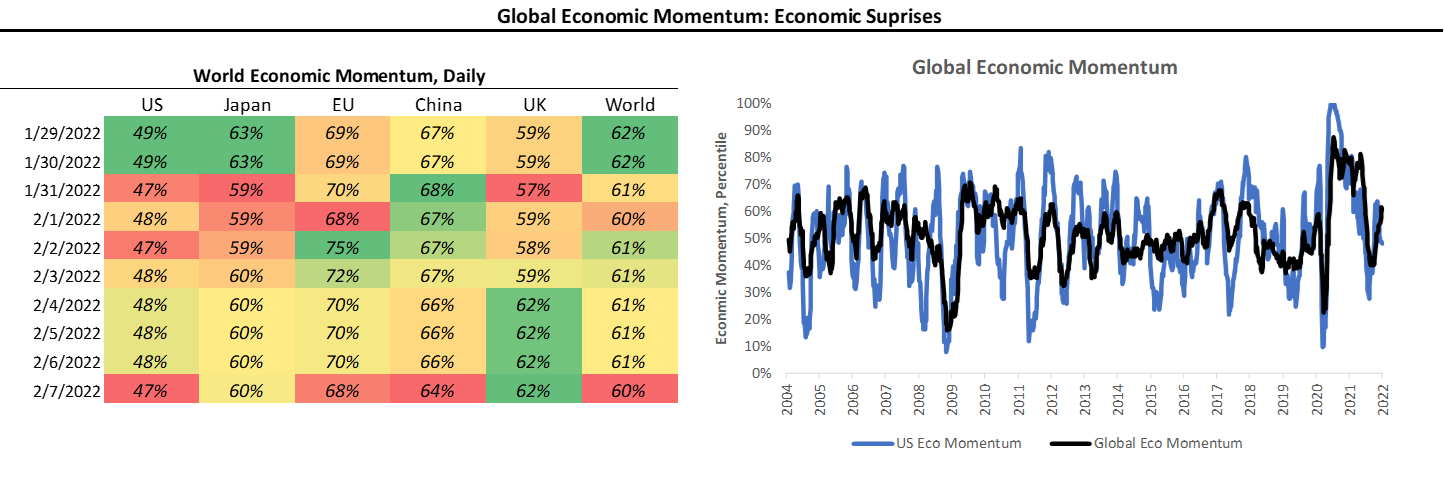
Global Economic Momentum: Today was a light day for global economic data, with no extremely significant data out today. However, we remain at an uncomfortable junction, with US economic momentum declining, and the rest of the world likely to follow suit. This week, we have the all-important US CPI print on Thursday. Markets are likely to fixate on this data as it will tell us more about how the Fed is likely to move on monetary policy in March.
Global Policy: The ECB extended its hawkish pivot today, with Christine Lagarde telling the markets the prospective adjustment to monetary policy will be gradual. This would be the first interest rate hike by the ECB in decades, and will likely have reverberations throughout the economy. However, this hike would be a long ways off, and the Fed’s tightening of global financial conditions could very well cause global deflation, cancelling out any need for the ECB to hike in the future.
Global Market Trends: Today was a risk-off day, with US and Japanese stocks down, commodities down, and surprisingly, the dollar down as well. Interestingly, gold shone as the single safe haven today, telling us that markets could begin to price stagflation. However, this would require gold to continue to strengthen, which remains to be seen.
Now, for those looking for more detail, let us look at the underlying models.
Global Economic Momentum: Daily
We start by tracking economic data relative to consensus expectations, as the impact of financial data on markets depends on whether its surprises the upside or downside. We standardize this data and call this indicator Economic Momentum, i.e., higher values are positive and lower values are negative. The color-coding in the table represents higher/more downward momentum for a given country:
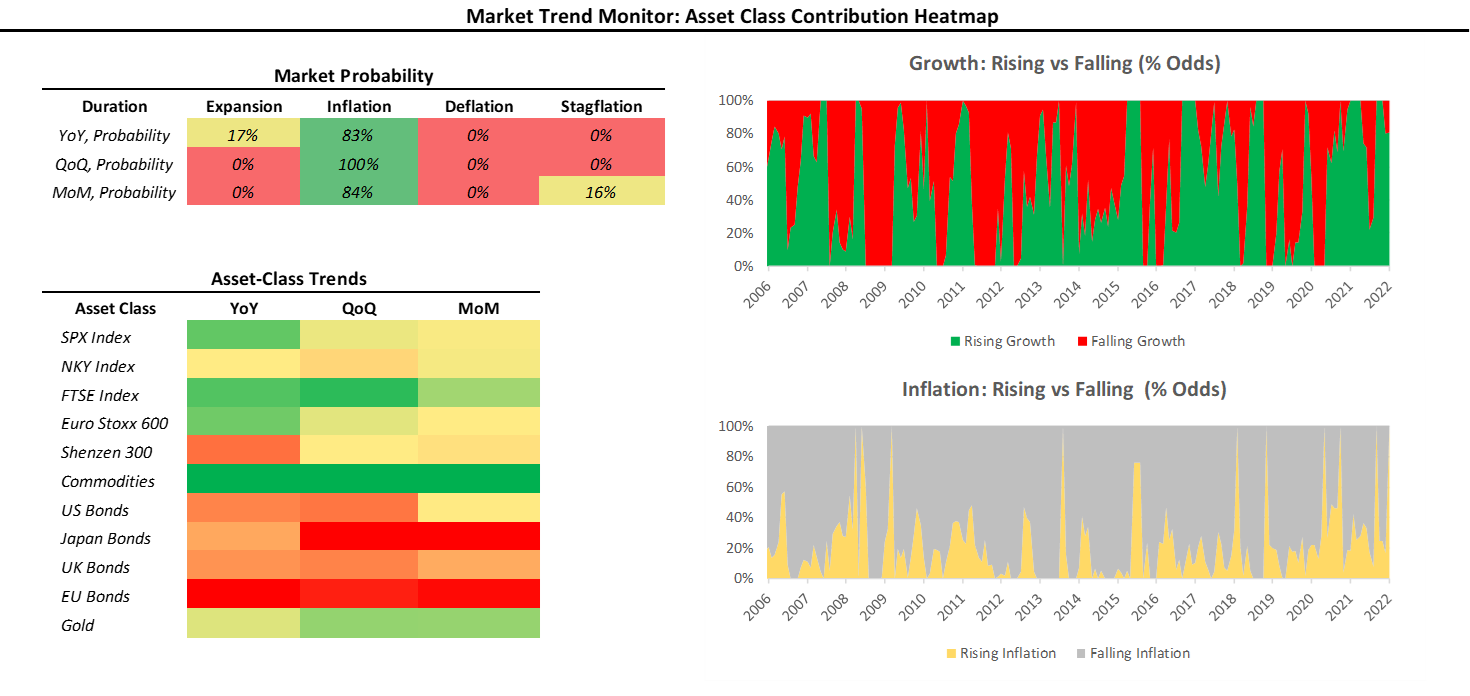
Market Trend Monitor: INFLATION
The table below shows the current market probability of the global economy experiencing expansion, inflation, deflation, or stagflation. The two charts show the odds implied by markets that economic growth is rising or falling, or inflation is rising or falling. Finally, the heatmap shows the contributions of major investment markets to these signals. There are three levels for our market probability estimates (monthly, quarterly, and yearly). We typically take the most signal from the yearly gauge and associate more informational value to higher frequency measures.
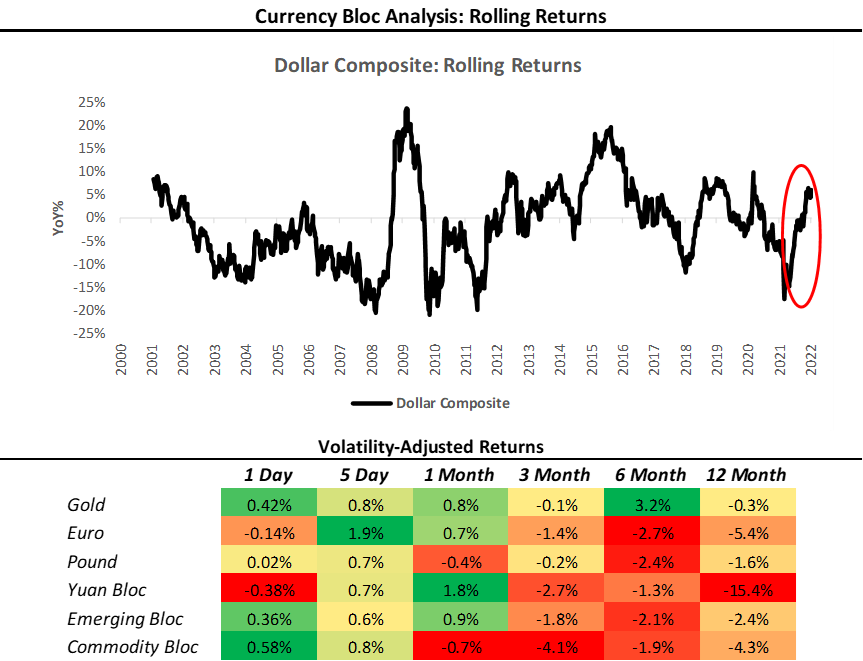
Currency Bloc Monitor: Dollar Composite
We proxy global capital flows using our Currency Bloc Monitor. The Currency Bloc Monitor aggregates FX price data from currencies that share high correlation characteristics, allowing us the gauge which area or asset in the global economy is attracting cross-border capital. The color-coding in the table reflects the strength of a Currency Bloc versus others for a given time frame. We aggregate these currencies versus the dollar and show our Dollar Composite below:
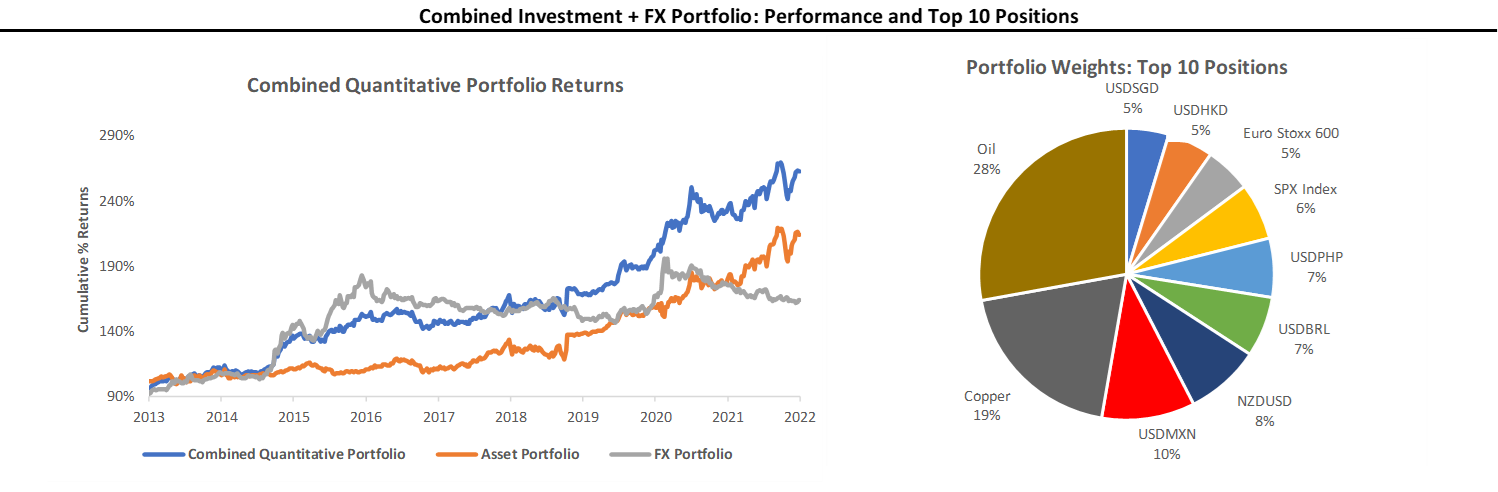
Quantitative Portfolio
We can construct a rules-based, quantitative model portfolio using our various models to detect price trends. This portfolio uses estimates of price trends, volatility, implied volatility, and macroeconomic drivers to allocate to different assets. Below, we show its most recent allocations:
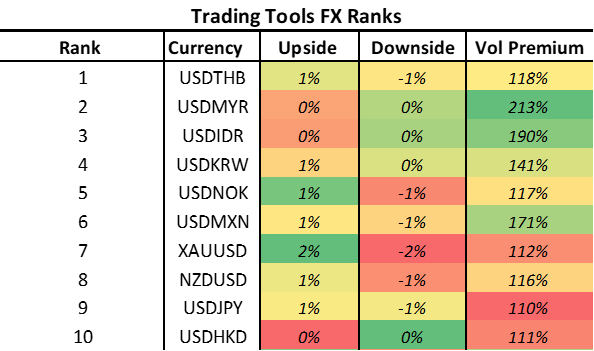
FX Signal Ranks: Top 10 Signals
In addition to providing our Quantitative Model Portfolio, we also provide our top 10 FX signals for the day, which our model selects from on a weekly basis. The rankings below reflect the strength of the signal:
We look forward to sharing our extensive library of content with you over the months to come. If you enjoyed these materials, feel free to share this with friends or colleagues, and don’t forget to subscribe for more!
Disclaimer: 75% of Retail Client accounts lose money when trading CFDs with FXDD Malta. You should consider whether you can afford to take the high risk of losing your money.