

On the Daily

Welcome to the FXDD Research: On the Daily newsletter. This publication provides readers with a sliver of our research process to help contextualize daily economic and market developments across the globe. We designed FXDD’s research process to be intuitive and actionable; therefore, you can expect regular call-outs on risk-reward scenarios we think are lucrative. We typically follow global macro markets, particularly the US, UK, EU, Japan, China, alongside the aggregate World economy. We also follow global assets, i.e., stocks, currencies, commodities, and fixed income (though to a lesser extent). We quantitatively do all this; therefore, you can expect most of our analysis to be standardized, consistent, and repeatable.
Week #6 2022:
Last week, markets continue to struggle with the increased hawkishness coming from the Fed, ECB, and BOE. Despite improving economic data from the US this week, global stock markets continued to take hits. On the flip side, commodity markets continued to stay buoyant, with Copper and Silver posting solid gains. Additionally, gold began to improve its performance for the year, acting as a safe haven asset after a long period of underperformance. The dollar was generally weaker amidst all this action, however, EURUSD continued to underperform and GBPUSD finished the week stronger. Overall, markets are trying to make sense of a very uncertain global outlook, on growth, inflation, and monetary policy, resulting in lots of volatility. Our quantitative strategies have fared well through these moves.
Turning to the week ahead in global macro:
Global Economic Momentum: Next week, we will get UK PMIs, EU CPI, US Initial Claims, and US Durable Goods, all of which could be market-moving events. EU CPI is likely to be a focus as we will see how ECB officials react to the, we expect it to be a strong one. In the US markets will focus on the Initial Claims data as well, as this will help markets decide if the Fed will hike 0.25% or 0.50%.
Global Policy: Next week, we have the BOE's Governor Bailey speaking, and markets will be closely monitoring his hawkishness. GBPUSD is likely to move. Additionally, we expect the FOMC to offer some guidance over the course of the next two weeks (prior to the blackout period for their meeting) as markets remain extremely uncertain about whether they will hike 25 or 50 basis points.
Global Market Trends: Markets continue to love inflation, which stays the primary market trend. Gold has perked up this week, and we think this is just another sign of ongoing inflation globally. Stock markets have a tough time when inflation gets this high, and so does the dollar. However, with central banks around the world tightening, the dollar still remains a safe haven currency, with significant trend support. Long dollars and long inflation we shall stay!
Now, let's take a look at some of the models behind our views.
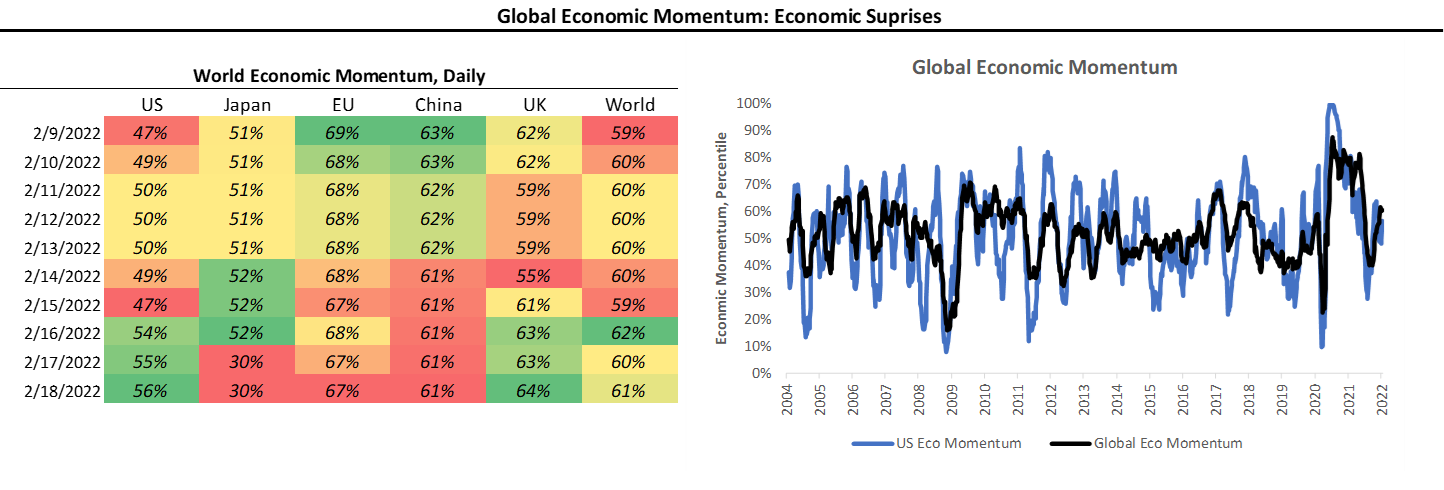
Global Economic Momentum: Daily
We start by tracking economic data relative to consensus expectations, as the impact of financial data on markets depends on whether its surprises the upside or downside. We standardize this data and call this indicator Economic Momentum, i.e., higher values are positive and lower values are negative. The color-coding in the table represents higher/more downward momentum for a given country:
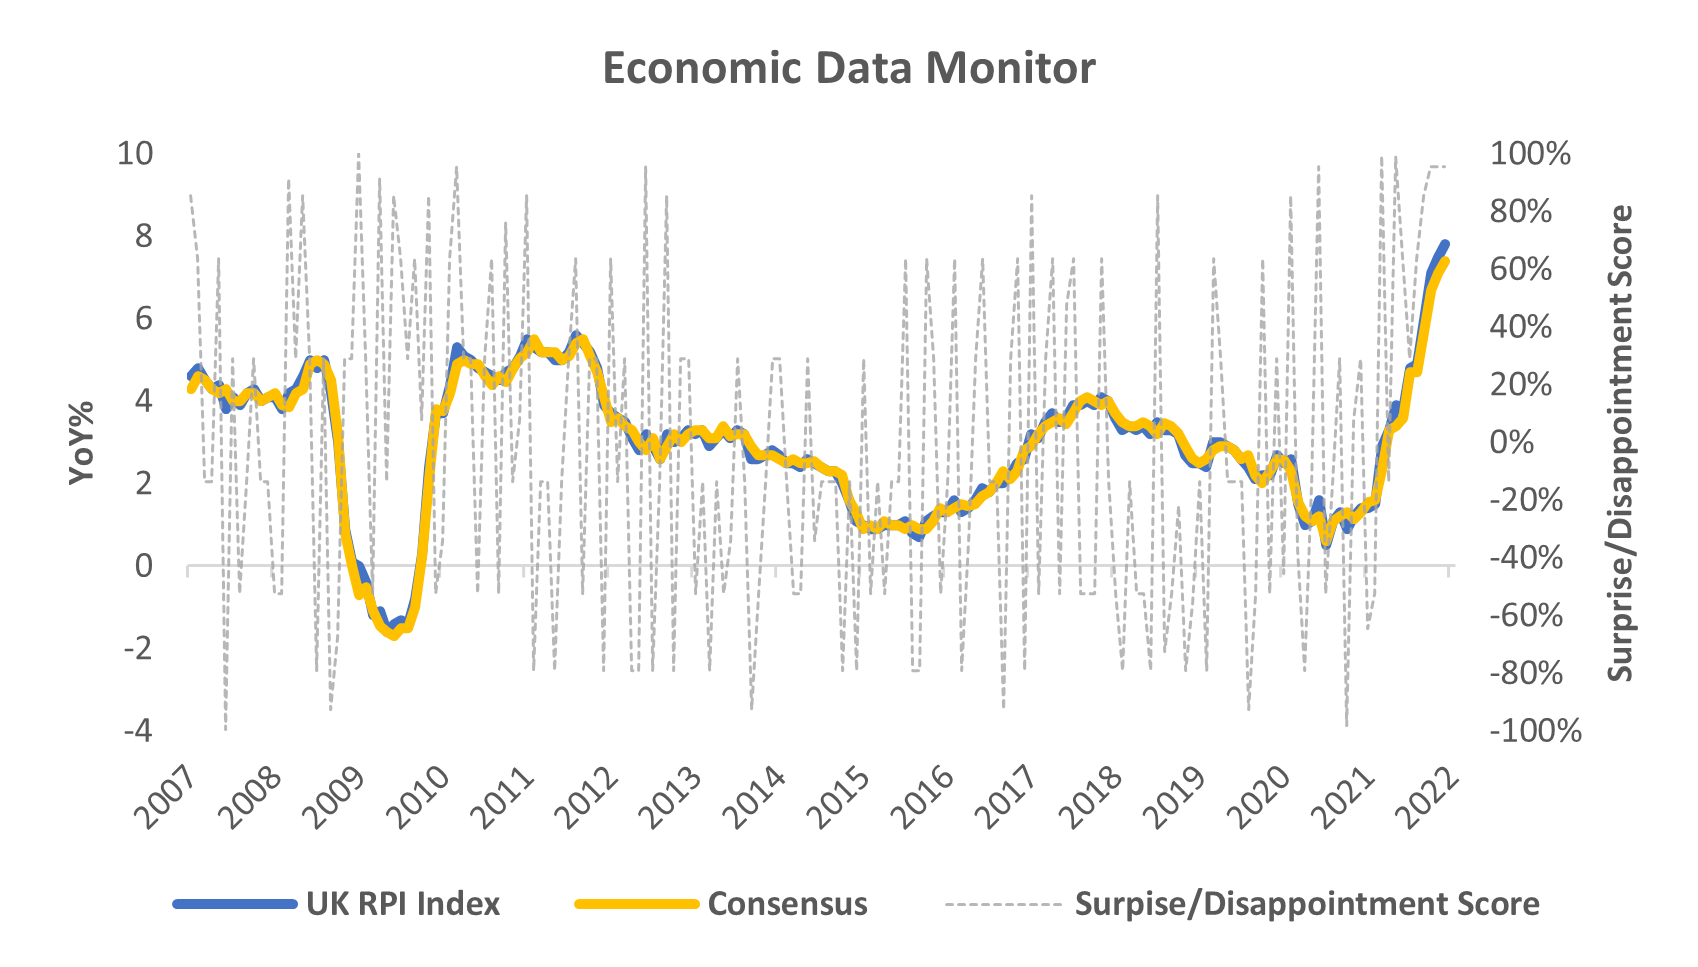
Economic Data Monitor: Today's Data
Under the surface of our Global Economic Momentum Indicators, we track each and every piece of data that impacts Economic Momentum. We highlight the most recent data for today below. We also show its surprise score, rates from -100 (surprise) to 100 (disappointment):
Market Trend Monitor: INFLATION
The table below shows the current market probability of the global economy experiencing expansion, inflation, deflation, or stagflation. The two charts show the odds implied by markets that economic growth is rising or falling, or inflation is rising or falling. Finally, the heatmap shows the contributions of major investment markets to these signals. There are three levels for our market probability estimates (monthly, quarterly, and yearly). We typically take the most signal from the yearly gauge and associate more informational value to higher frequency measures.

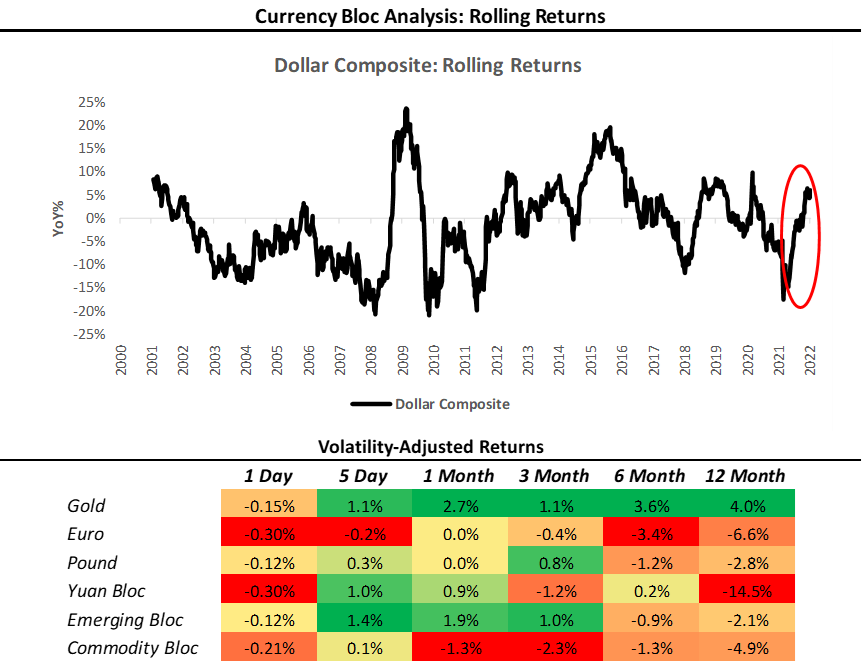
Currency Bloc Monitor: Dollar Composite
We proxy global capital flows using our Currency Bloc Monitor. The Currency Bloc Monitor aggregates FX price data from currencies that share high correlation characteristics, allowing us the gauge which area or asset in the global economy is attracting cross-border capital. The color-coding in the table reflects the strength of a Currency Bloc versus others for a given time frame. We aggregate these currencies versus the dollar and show our Dollar Composite below:
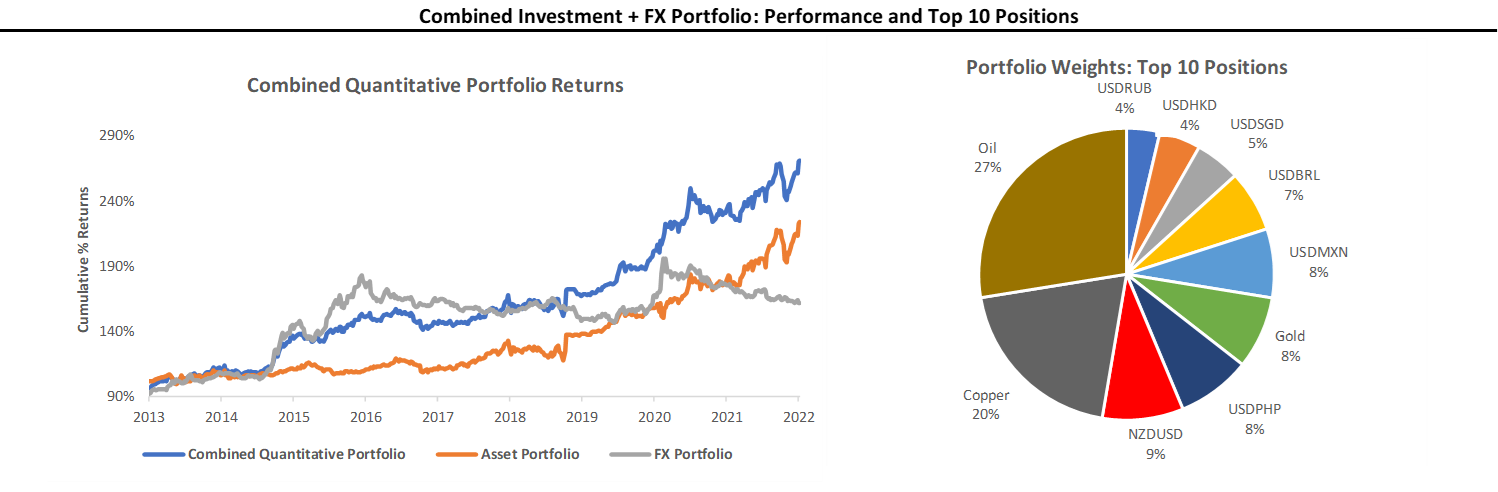
Quantitative Portfolio
We can construct a rules-based, quantitative model portfolio using our various models to detect price trends. This portfolio uses estimates of price trends, volatility, implied volatility, and macroeconomic drivers to allocate to different assets. Below, we show its most recent allocations:
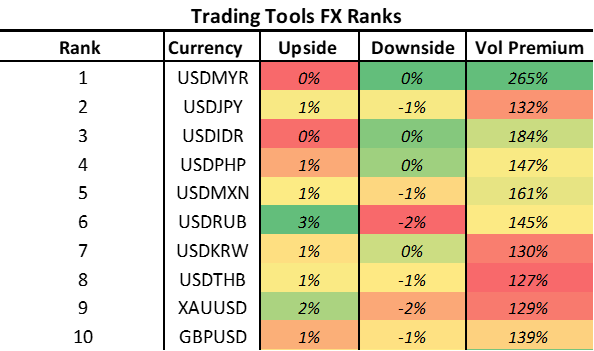
FX Signal Ranks: Top 10 Signals
In addition to providing our Quantitative Model Portfolio, we also provide our top 10 FX signals for the day, which our model selects from on a weekly basis. The rankings below reflect the strength of the signal:
We look forward to sharing our extensive library of content with you over the months to come. If you enjoyed these materials, feel free to share this with friends or colleagues, and don’t forget to subscribe for more!
Disclaimer: 75% of Retail Client accounts lose money when trading CFDs with FXDD Malta. You should consider whether you can afford to take the high risk of losing your money.